Introduction
Incoming solar radiation heats Earth’s atmosphere and ocean, resulting in a near-equilibrium thermodynamic state that determines the climate. This near-equilibrium state is maintained by the global cycles of heat and freshwater storage and the global carbon cycle, and significant changes in any of these would likely result in departures from climatic equilibrium. The ocean covers nearly 70% of the planet’s surface, and it plays an essential role in setting these cycles. As a reservoir, the ocean holds over 97% of the global inventory of freshwater, and the details of the exchanges of this water with the atmosphere place important constraints on the state of the climate. How, where, and how much water is exchanged between the ocean and atmosphere are essential issues that arise in studies of the global water cycle.
While historically the ocean has been the most poorly sampled regime on Earth’s surface, the growing availability of satellites and autonomous platforms over the past two decades has allowed substantial improvements to be made in our ability to observe the ocean and to assess climate cycles. To begin to examine the interaction of this variability in the open ocean, a major field experiment known as SPURS (Salinity Processes in the Upper-ocean Regional Study) was conducted in the eastern North Atlantic in 2012–2014 in order to observe in detail a region where evaporation from the ocean was a major factor in determining the regional freshwater balance and the distribution of ocean salinity. Many papers have appeared based on findings from this program, and an entire issue of Oceanography was devoted to these results (see Lindstrom et al., 2015; https://tos.org/oceanography/issue/volume-28-issue-01). In 2016, a complementary field program, SPURS-2, sponsored by NASA with important contributions from NOAA and the National Science Foundation, was launched in the eastern tropical Pacific Ocean to examine the interaction of the near-surface ocean and the atmosphere in a region where precipitation was the major agent in the cycling of freshwater. This paper describes some of the results from SPURS-2, especially near-surface measurements of rainfall, ocean salinity, and wind from satellites and specially equipped profiling floats.
Basin-Scale Climatology
The tropical Pacific Ocean is a vast region characterized by strong zonal flows in both the ocean and the atmosphere, with strong seasonality in both regimes. As can be seen in Figure 1, the surface winds in 2016 (as SPURS-2 began) were spatially variable, blowing throughout the year with a strong westward component west of about 120°W at all latitudes between 5°S and 20°N; east of 120°W, the wind direction was more variable. In boreal spring (May), sea surface temperature (SST) was highest between 5°N and 12°N in the region west of 120°W, with this region expanding south to 5°S east of 120°W. In autumn (November), the warmest region west of 120°W was between 5°N and 10°N, and east of this meridian, the highest temperatures occurred south of the equator. In boreal spring, the lowest sea surface salinity (SSS) both east and west of 120°W was coincident with the highest SST, with even lower SSS farther east. In autumn, the band of low SSS west of 120°W continued, with a band of very low SSS only 2°–3° of latitude in extent, between just north of the equator and 10°N, emanating from the coast of South America during this period.
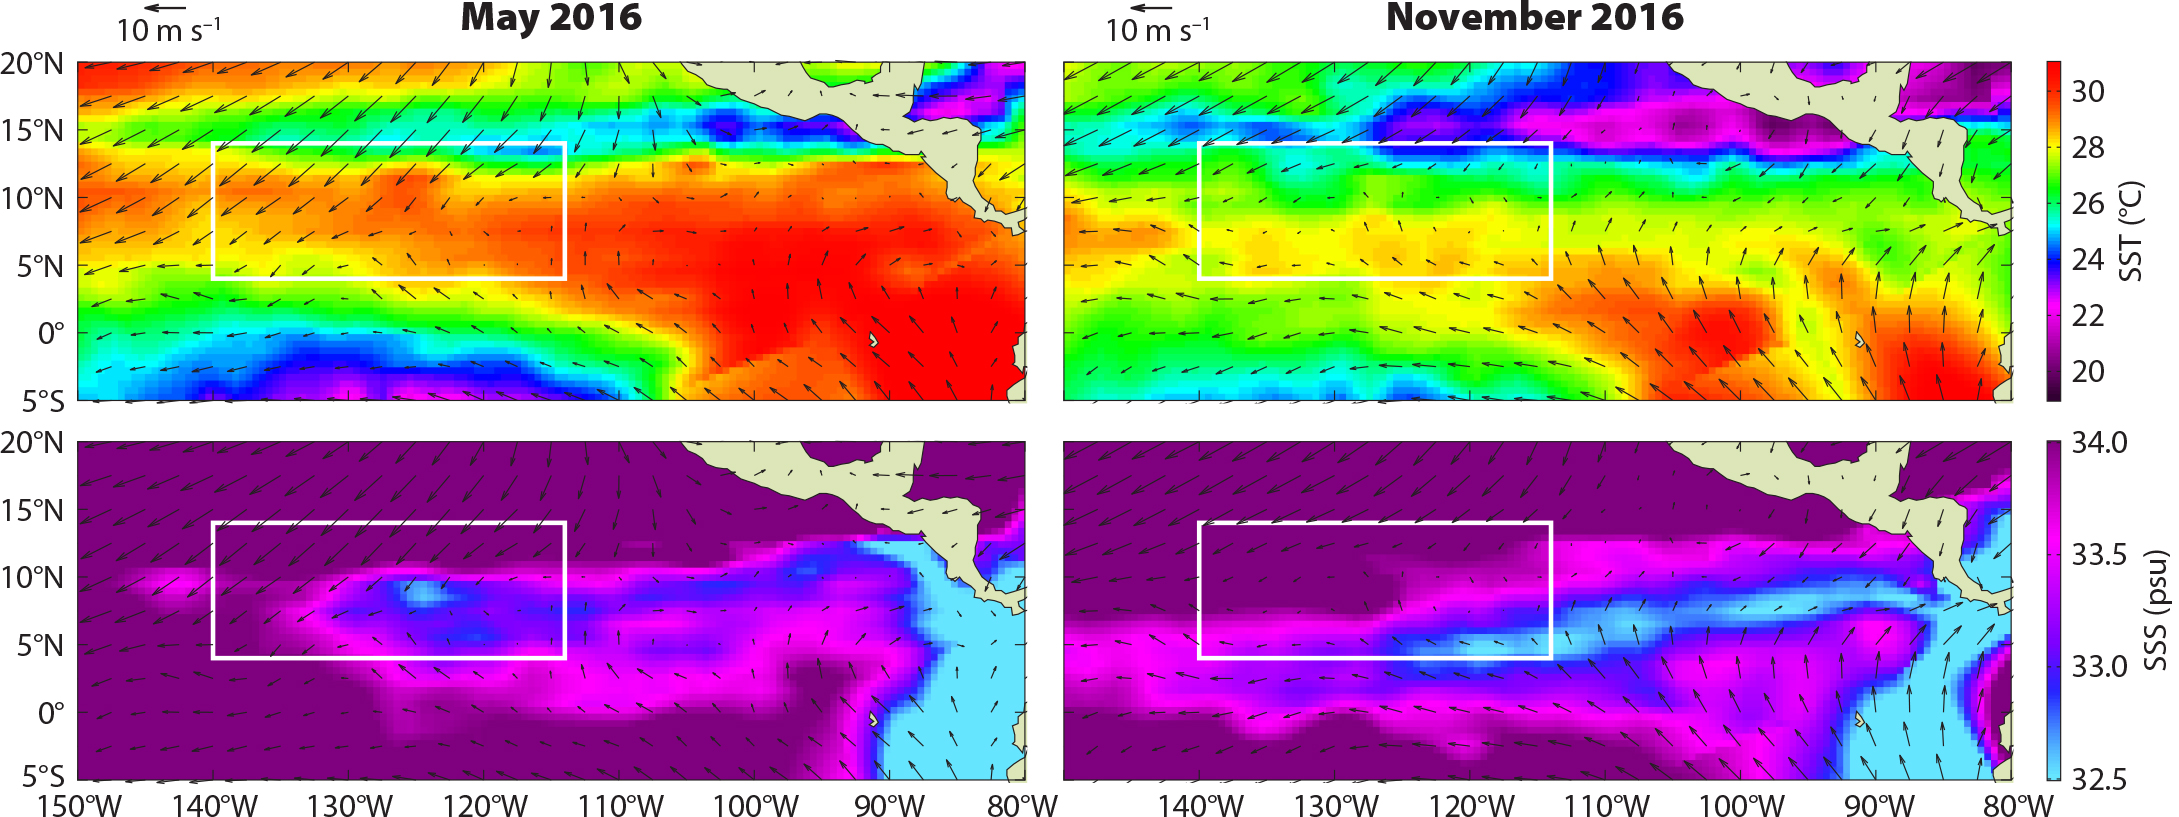
FIGURE 1. (top panels) Sea surface temperature (colors) and wind (vectors) for the eastern tropical Pacific for May and November of 2016. (bottom panels) Sea surface salinity (colors) and wind (vectors) for the eastern tropical Pacific for May and November of 2016. The white box denotes the general region examined by profiling floats in the SPURS-2 experiment discussed in this work. Sea surface temperature and salinity data are from 1°, gridded monthly averages in the Roemmich-Gilson climatology (described in Roemmich and Gilson, 2009, and updated through 2016). Winds are from the NCEP/NCAR reanalysis six-hourly wind product (originally described in Kalnay et al., 1996). > High res figure
|
The low SSS region east of 120°W in the autumn of 2016 was coincident with the eastern Pacific Intertropical Convergence Zone (ITCZ) in the atmosphere, an area where low-level northeast and southeast winds collide in the region 8°–10°N. This convergence is a region of strong atmospheric convection, resulting in ubiquitous thunderstorms and rainfall over much of the year. The SPURS-2 program was sited in the western portion of the ITCZ region in order to be able to examine in detail the seasonality of the interactions between the winds, precipitation, and surface ocean circulation and their effects on near-surface salinity.
This region is part of the larger-scale Eastern Pacific Freshwater Pool, whose overall seasonal and longer-term variability have been discussed in considerable detail by Guimbard et al. (2017). That study showed the complex interplay of wind, advection, and subsurface Ekman effects that occur in the equatorial Pacific, as well as the manifestations in the eastern part of the basin, where the surface salinities are lowest.
SPURS-2 Observations from Profiling Floats
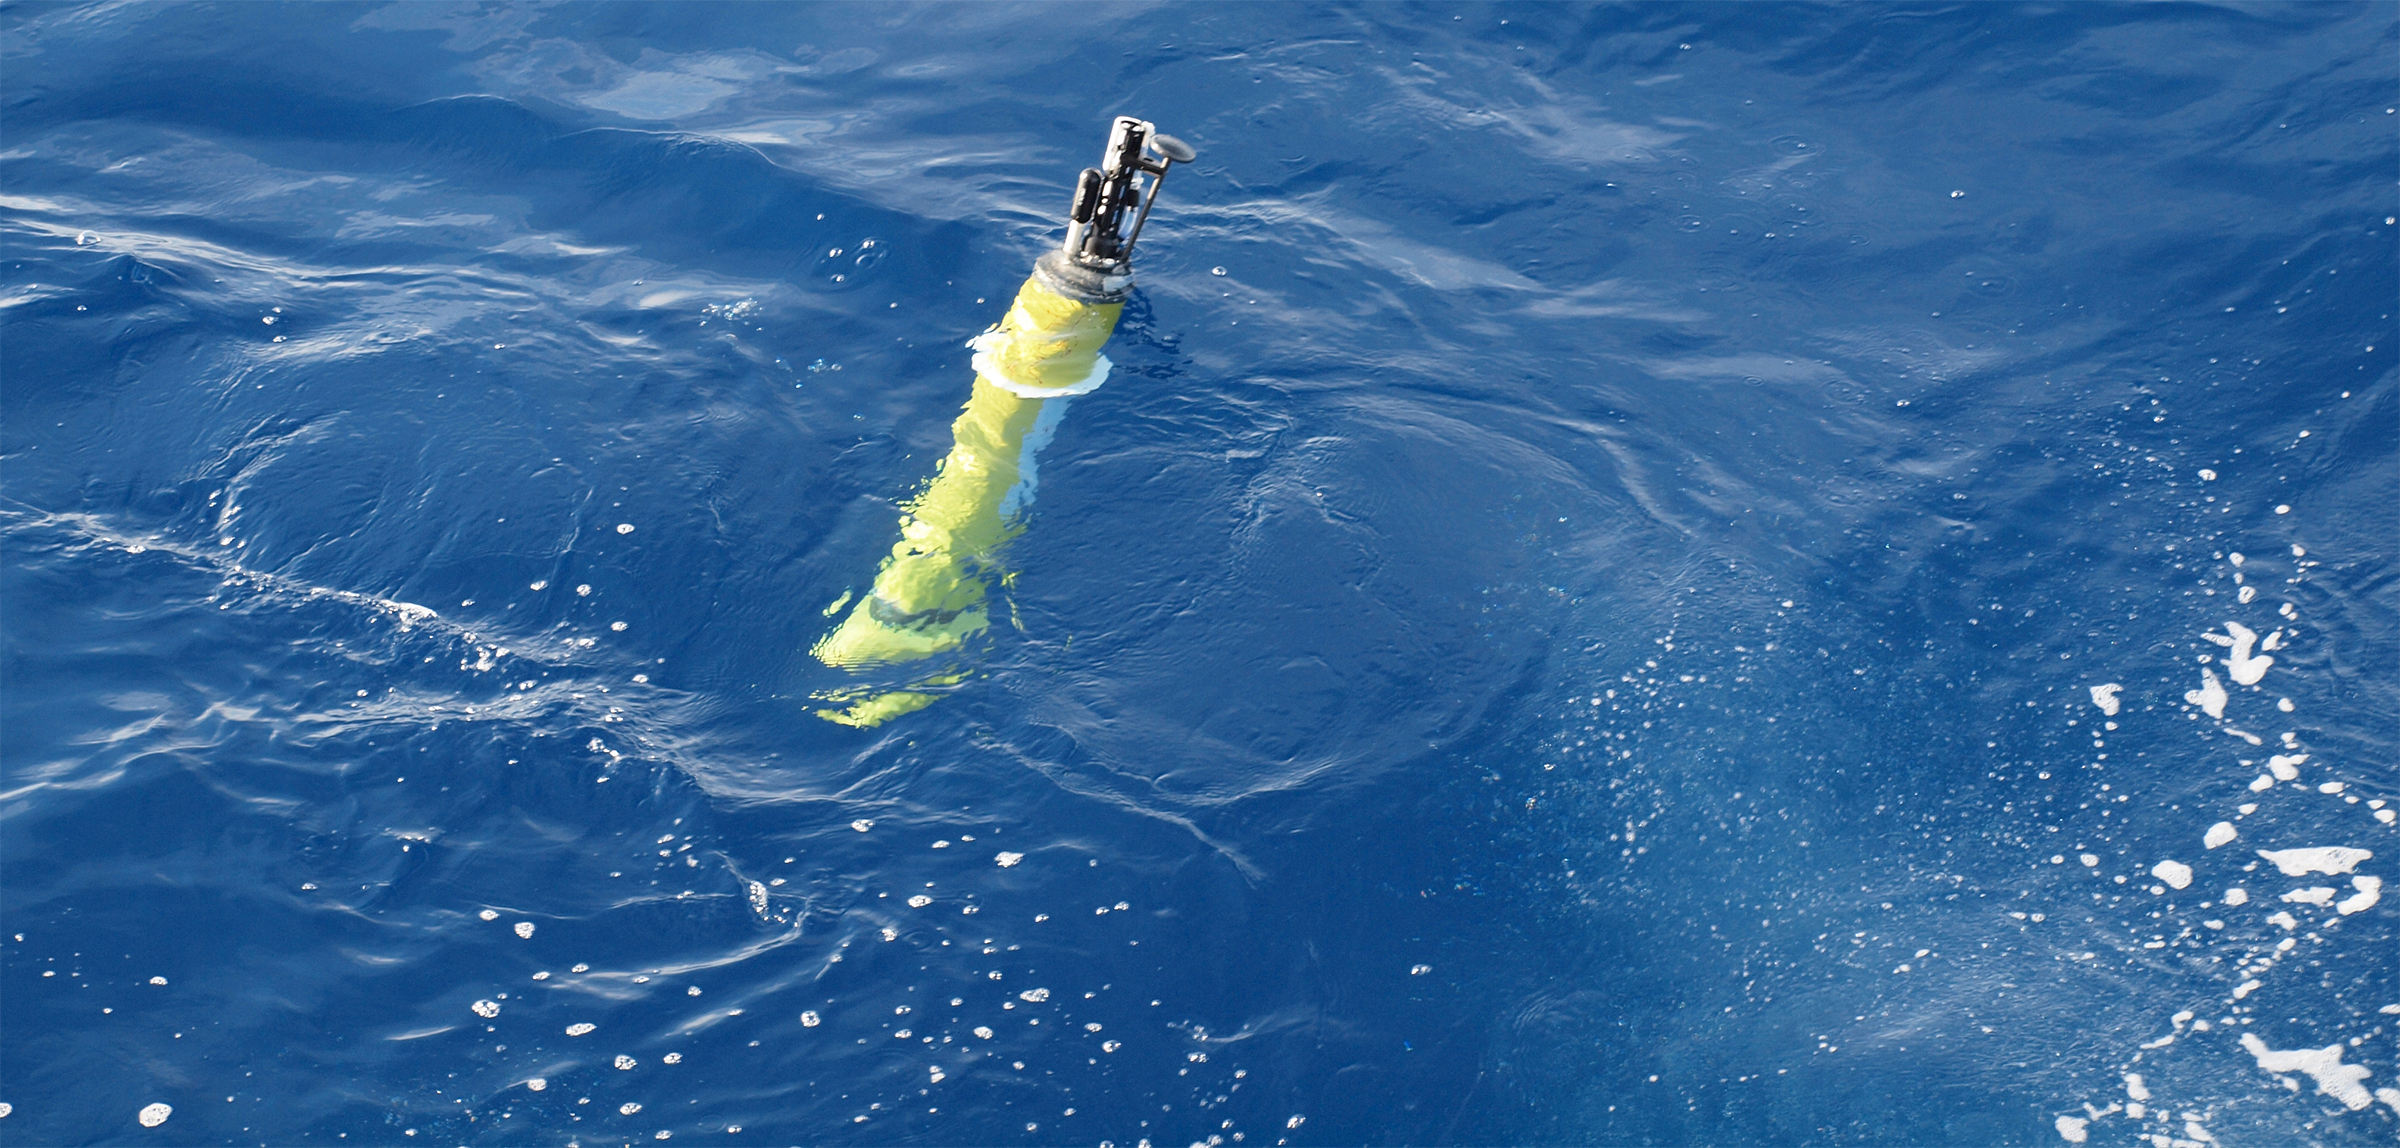
The low values of SSS (<33 psu) occurring beneath the ITCZ in autumn (shown in Figure 1) are likely due to the strong seasonal rainfall in the region. As can be seen from Figure 2 (constructed using data from over 13,000 Argo profiles collected in the equatorial Pacific since 2001; Riser et al., 2016), the ITCZ is the only region in the entire tropical Pacific domain where such low values of SSS regularly occur. To examine this phenomenon, SPURS-2 investigators deployed an array of 15 profiling floats to drift inside the white box shown in Figure 1 and measure the properties of the water column above 2,000 m, especially in the upper few hundred meters. These floats were standard Argo-type APEX profiling floats built at the University of Washington from components purchased from Teledyne/Webb Research Corporation. The floats collected profiles of temperature (T) and salinity (S) as a function of pressure (p) in the water column above 2,000 decibars. Immediately after deployment, many of the floats were set to cycle at one-day intervals; after one or two weeks, the missions reverted to the canonical Argo period of 10 days. In addition to collecting T/S/p data, three of the floats were equipped with Passive Aquatic Listener (PAL) units capable of estimating wind speed and rainfall at quasi-hourly intervals during the period that the float was parked near 1,000 m depth, using passive acoustic techniques. The PAL units were built at the University of Washington Applied Physics Laboratory. The floats were deployed in the autumn of 2016 and collectively had sampled T, S, and p on more than 3,100 profiles by mid-2018.

FIGURE 2. A map of the tropical Pacific showing the locations of more than 13,000 profiles from a region in the Argo database as of October 2018 (small gray dots that cover most of the ocean area). Red dots denote profiles where the shallowest measured salinity (usually at depths <5 m) was less than 33 psu. > High res figure
|
Trajectories from the 15 SPURS-2 floats (Figure 3a) indicate that the horizontal flow in the region is generally zonal at the parking depth (~1,000 m), with a highly banded structure. Several of the floats reversed direction on multiple occasions as they traveled slightly north or south and encountered various zonal jets; the jets themselves migrate north and south seasonally, adding to the reversals in the trajectories. Using older float observations in this region, Cravatte et al. (2012) investigated the zonally banded structure seen here, noting that between the equator and 10°N there were as many as eight reversals in the direction of the zonal jets at 1,000 m. This complexity is obvious in Figure 3a. The T and S data collected by the floats (Figure 3b) show the recurring presence of very low-salinity water near the sea surface. The low S values (<33 psu) shown in Figure 3b are spatially coincident with those shown in the ITCZ region in Figure 2, and the pressure levels where these data were collected serve to indicate that salinity values <33 psu are likely to occur in the water column at depths as great as 50 m. The presence of even lower S values (<32 psu) at depths shallower than 10 m in Figure 3b suggests that these low salinities originated at the sea surface due to precipitation, and that near-surface mixing (presumably by the wind) was strong enough to carry the low-salinity, rain-induced signal downward into the upper edges of the ocean interior (see more examples of this in Anderson and Riser, 2014). For the eastern tropical Pacific, Yu (2015) shows that the region of lowest SSS and highest precipitation are generally coincident, but in other portions of the Pacific and in other tropical oceans this is not always the case, due to dynamical differences between the wind-driven nature of oceanic fronts and flows and the spatial distribution of precipitation in the atmosphere.
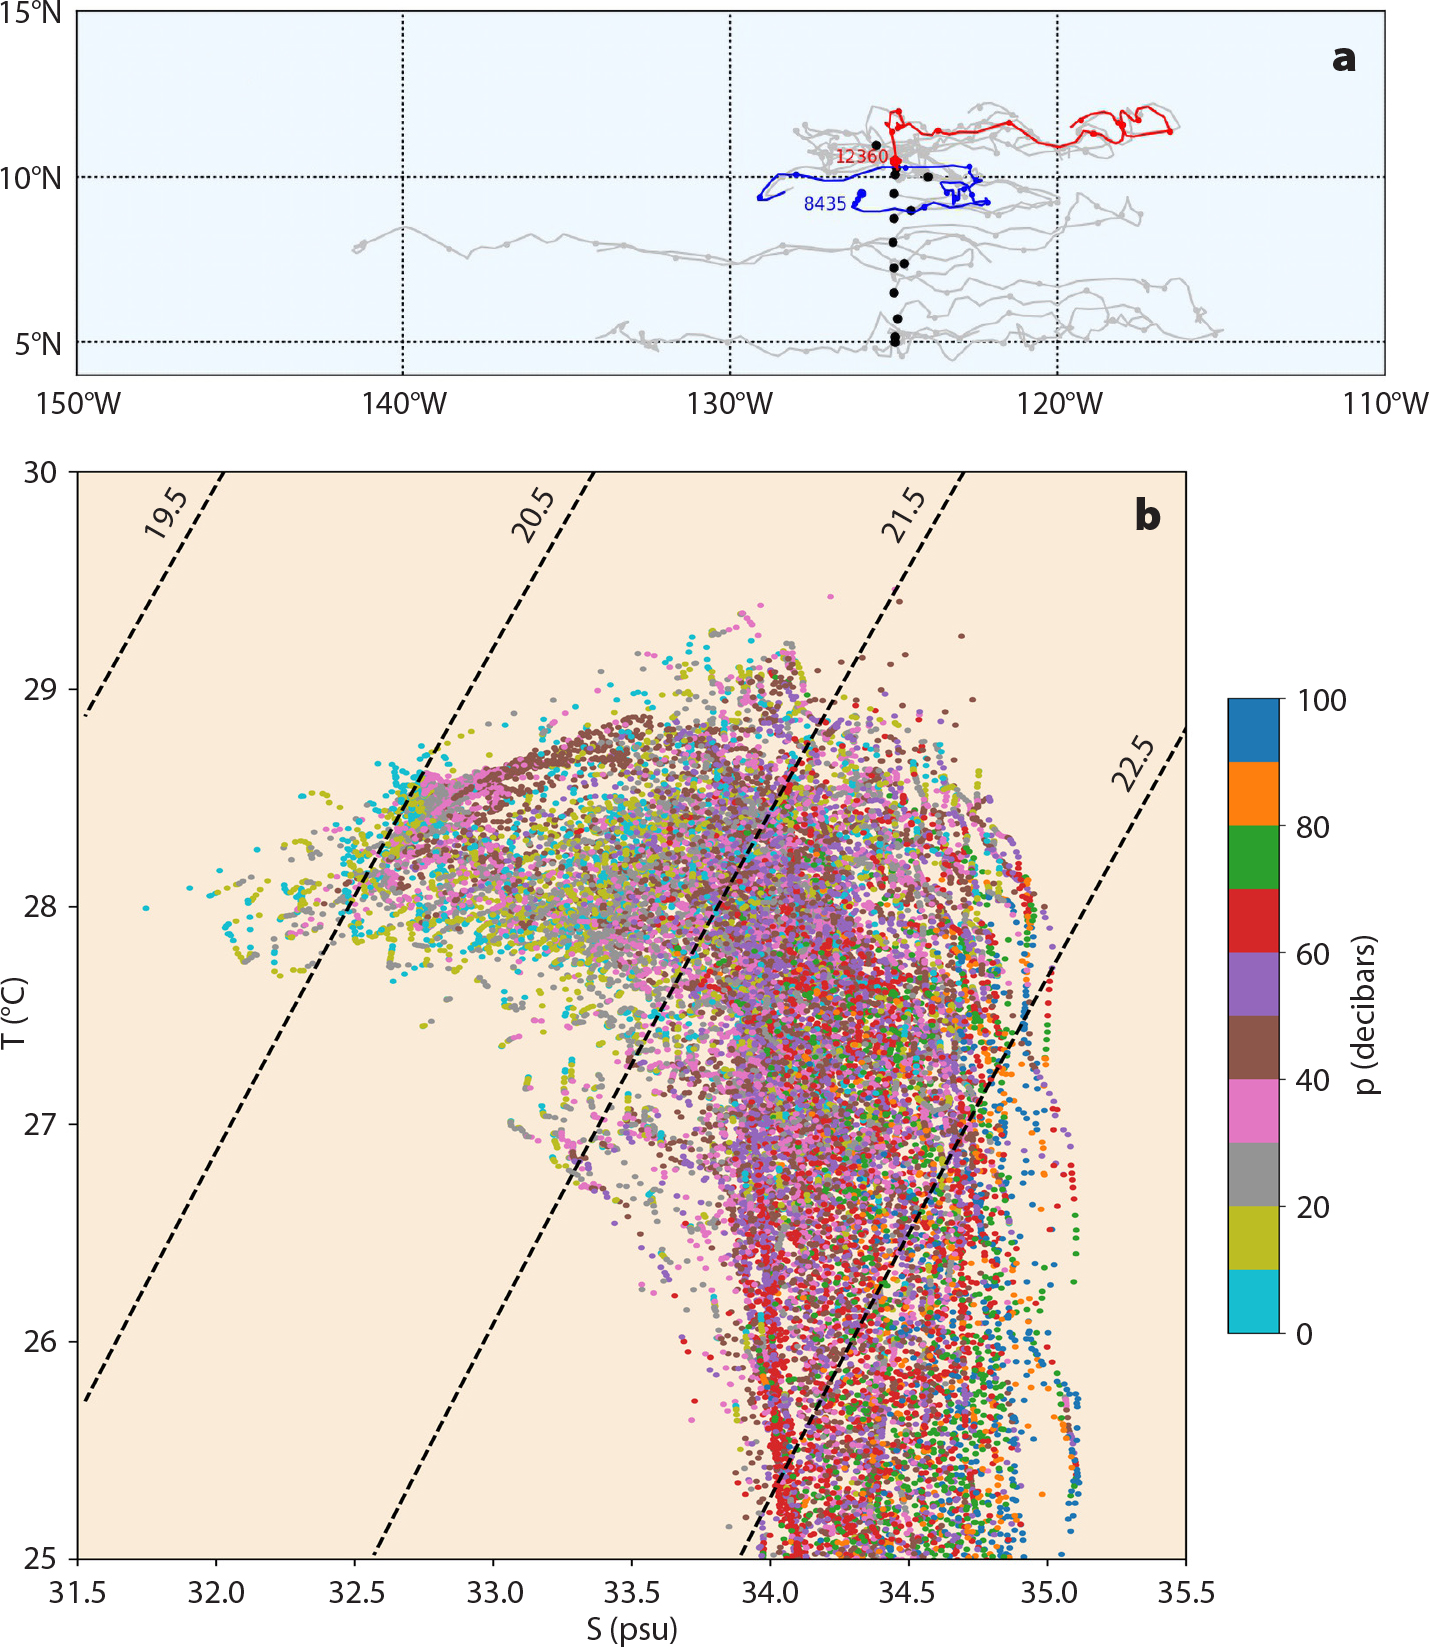
FIGURE 3. (a) Trajectories of 15 profiling floats deployed by the University of Washington as part of SPURS-2. The trajectories span the period from September 2016 through May 2018. Black dots denote the deployment locations of the floats. Small dots along the trajectories are shown at 60-day intervals. The red and blue trajectories denote floats 8435 and 12360, respectively. (b) The upper ocean T/S relation for all profiles collected from the floats shown in (a). Colors show the depth/pressure where the data points originated. Dashed lines denote contours of constant σt. > High res figure
|
Rainfall, Wind, and Near-Surface Salinity
Three of the floats shown in Figure 3a carried PAL units for measuring wind speed and rainfall. This technique and the associated instrumentation are discussed in detail and documented in Riser et al. (2008) and Yang et al. (2015). The PAL unit employs passive acoustic techniques and operates on the principle that in general the loudest sounds occurring below the sea surface in the open ocean arise from rain and wind at the air-sea interface. These sounds are caused by bubble activity generated by the wind or impacting raindrops (Nystuen and Medwin, 1995) and are sufficiently loud to be detected at a depth near 1,000 m by the PAL hydrophone; the PAL samples at intervals of a few minutes while the float is drifting at its parking depth. The acoustic spectrum generated by these bubbles can be inverted in order to make useful quantitative estimates of wind and rain conditions at the ocean surface. Acoustic signals arriving at the PAL generally originate at the sea surface inside a region with a radius two to four times the depth of the float; thus, for a float parked at 1,000 m, the wind and rain signals likely come from within 2–4 km of the surface projection of the float position. Of course, ships and marine mammals also produce acoustic signatures, but the likelihood of an encounter of either of these with a float in the open sea is generally small compared to ubiquitous wind and rain, and both have spectral characteristics that are distinct from the sounds produced by wind and rain.
Wind speed, rainfall, and upper-ocean salinity as functions of time from autumn of 2016 to late spring of 2018 for one of the floats (shown in Figure 4) that was equipped with PAL units (UW float 8435, WMO 5904668) exhibit clear seasonal signals. Rainfall is weak early in 2017 (January–May) when the float is generally near the southern edge of the low-salinity frontal region shown in Figure 1. By June, the rainfall has increased to amounts of 25–50 mm d–1 along the float path as the float is positioned roughly 50 km south of the ITCZ; the rain rate remains statistically similar, with a slight increase into the fall, until early in the following year. Float 12360 (WMO 5904777; data not shown here), was slightly north of the ITCZ and showed somewhat lower rainfall than float 8435.
For purposes of comparison to PAL, we also show rainfall estimates from NASA’s Global Precipitation Measurement (GPM) mission, an international effort ongoing since 2014 to merge the data from several satellites that have the capability of measuring rainfall from space (using active radar and passive microwave techniques) into a single product (Hou et al., 2014). The GPM data used here have been gridded at 0.25° and are available at three-hour intervals. The data have been interpolated in space and time to the location of the floats so that comparisons can be made with the PAL rain estimates. As can be seen in Figure 4, these two independent measures of rainfall agree well (correlation coefficients of 0.763) in their estimation of when precipitation is occurring. The PAL daily estimate of rainfall generally exceeds that from GPM, which may be due to the fact that the PAL estimate is local while the GPM estimate has been gridded and smoothed.
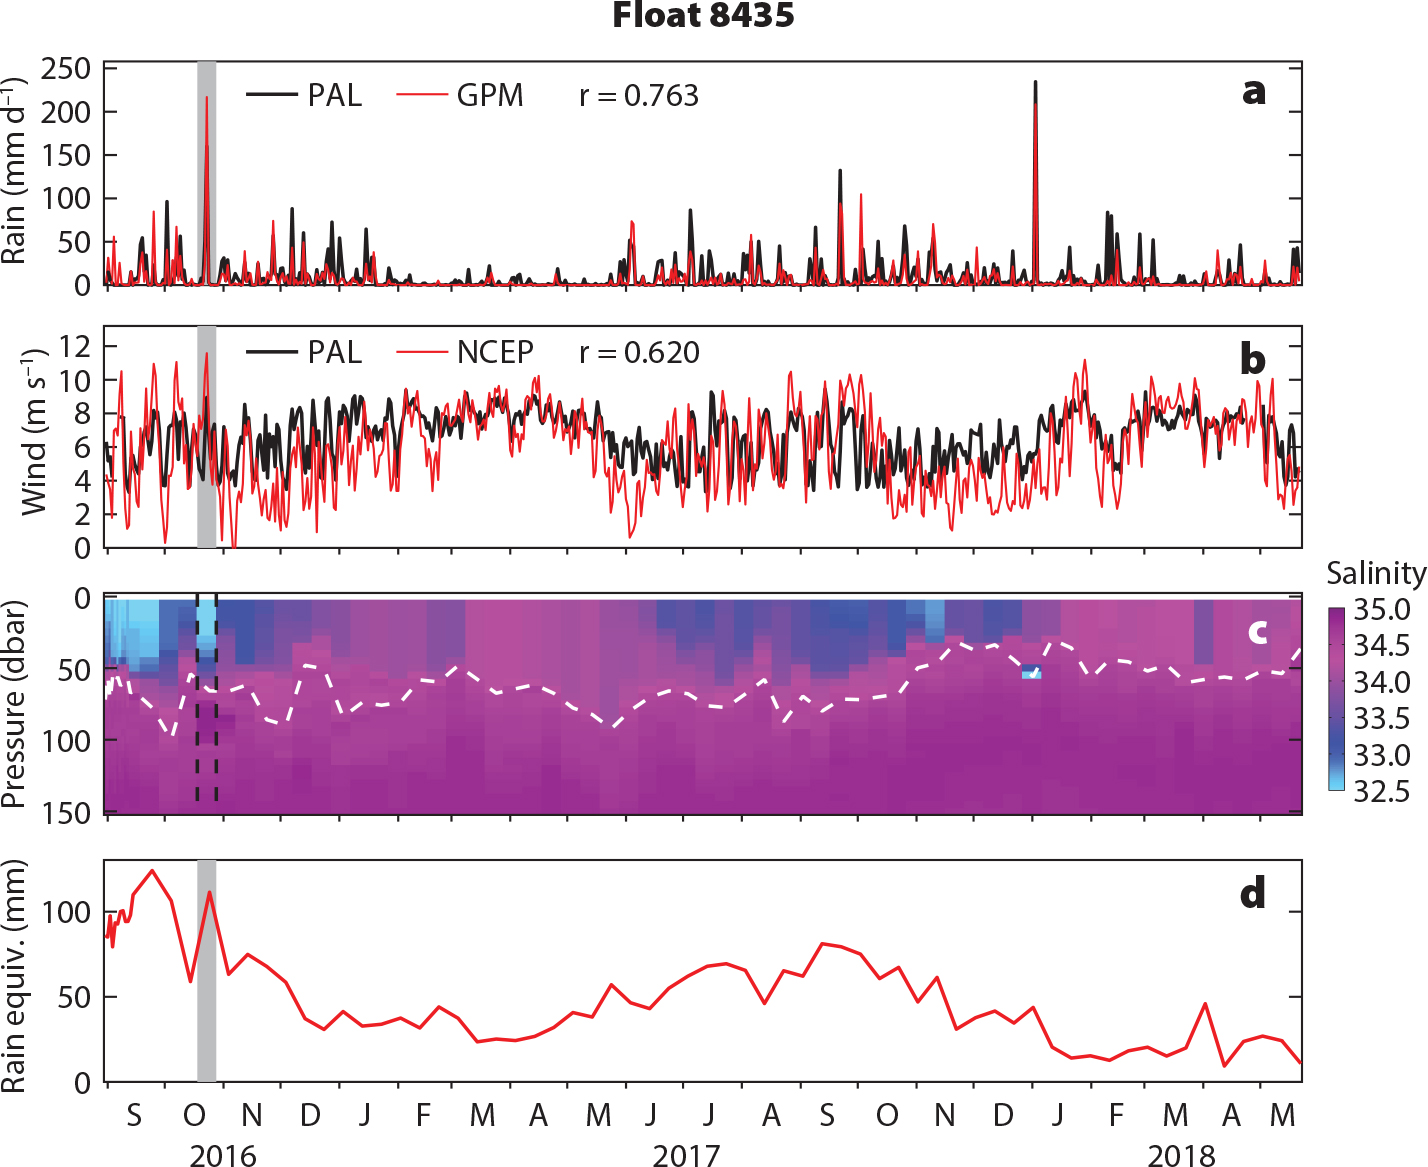
FIGURE 4. (a) Rainfall measured by the Passive Aquatic Listener (PAL) unit on float 8435 and NASA’s Global Precipitation Measurement (GPM) mission-based rainfall estimates interpolated to the float positions. (b) Wind speed measured by the PAL unit on float 8435 and NOAA National Centers for Environmental Prediction (NCEP)-based wind speed estimates interpolated to the float positions. Both the rainfall and wind speed estimates are displayed as daily averages. (c) Salinity as a function of pressure and time for all profiles for float 8435. The dashed white line shows the depth of surface anomaly penetration za (see text for explanation). (d) The rainfall equivalent Req of freshwater required to account for the salinity anomaly Sa above za (see the text for explanation). Data from float 12360, not shown here, provide similar results. The gray bars and vertical dashed lines on the panels denote the timing of the large precipitation event in late October 2016 discussed in the text and shown in Figure 5. > High res figure
|
PAL-based estimates of wind speed suggest that for float 8435 the wind speed is high early in the year (8–10 m s–1) when the rainfall is smallest, with a maximum wind speed in April and May. At other times during the year, the winds are generally weaker, but there is considerable variability at both floats and no general trend. The period of maximum wind speed occurs when the float is farther from the ITCZ; nearer to the ITCZ, where the atmospheric flow is strongly three dimensional, the local wind speed is somewhat reduced, as it is in the second half of each year. In order to assess the quality of the local wind sensed by the PAL technique, we show winds estimated by the National Centers for Environmental Prediction (NCEP) in Figure 4. The NCEP winds shown here have been interpolated and collocated with the float track (data from float 12360 is not shown here, but its characteristics are similar to those of float 8435), and the two estimates of wind generally show similar variability (correlations of 0.62). As was the case with rainfall estimates, the differences in the wind speeds in these two data sets are likely due to the local nature of PAL winds compared to the gridded and smoothed values provided by NCEP.
Also in Figure 4, salinity is shown as a function of depth/pressure and time, measured along the float trajectory over the two-year observational period. Salinities are lowest during the second half of the calendar year, when rainfall is greatest. The low-salinity water (≤33 psu) that originates at the sea surface (see Figure 3b) in this region during periods of high precipitation can be seen nearly as deep as 50 m below the sea surface late in the annual cycle (September–November). Along the trajectory, a scenario develops where rainfall is relatively high late in the year (~50 mm d–1), and the wind is also relatively strong (6–8 m s–1)—strong and persistent enough to transform the surface low-salinity water into a low-salinity mixed layer that is nearly 50 m thick. Eventually the rainfall weakens, in the spring of the year, and the salinity of the mixed layer increases by nearly 1 psu as the wind reaches its annual maximum speeds and mixes higher-salinity surface water down into the mixed layer. This represents a somewhat over-simplified, one-dimensional view of a system that is actually multidimensional, with temporal and zonal variability along the trajectories and meridional additions from Ekman transport, as reported by Yu (2014). Yet that study found that in this region of the eastern tropical Pacific the largest contributor to the overall salinity budget was the downward flux of freshwater (rain) from the surface, rather than other effects such as Ekman transport that do tend to dominate the budget elsewhere in the tropical Pacific.
We have attempted a simple quantification of this wind-induced mixing of low-salinity water into the surface mixed layer along the path of float 8435, as illustrated in Figure 4d. Here, we have estimated a reference salinity Sref and its standard deviation μ for the float (on each profile) as the mean and standard deviation of the measured salinity between 100 m and 2,000 m (the former value is generally below the bottom of the surface mixed layer; the latter value is chosen as a stable reference, where the salinity changes are not large). We then estimate the lower limit (or base) of the rain-influenced layer as the depth za at a depth shallower than 100 m where the measured salinity S first falls below a value of Sref – µ. At each level shallower than za we can then define a salinity anomaly Sa equal to Sref – S. We might expect that Sa > 0 at levels where rainfall has at some point freshened the water column; that is, the measured salinity S falls below the reference salinity and normal variability. In order to highlight such cases suspected to be due to rainfall, in the few cases where Sa < 0 (at <5% of the total of observed points), we set Sa = 0 and do not consider these cases further. For each profile, the equivalent amount of rainfall, Req, required to account for the observed freshening is then the depth integral of all values of Sa for the profile at depths < za.
The value of za for each profile along the float path is shown by the white dashed line in Figure 4c. This depth is generally closely related to the depth of the surface mixed layer, not surprising because in most cases the salinity decreases toward the sea surface in the water column above 100 m, and the estimate of za is a measure of where the salinity begins to differ appreciably from salinities deeper in the water column.
The corresponding rainfall equivalent, Req, following the float (Figure 4d) can be interpreted as the amount of freshwater (i.e., rainfall) necessary to account for all of the salinity values less than Sa at depths less than za for each profile along the trajectory. For float 8435, the values of Req closely follow the precipitation and wind shown in Figure 4a,b, and a surface mixed layer 50–100 m deep is maintained throughout the entire annual cycle, presumably from wind forcing. In autumn, both Req and measured rainfall are large, with freshening from rain evident to deeper than 50 m in the water column. In spring, the data indicate that both rainfall and Req are small, even though the wind is relatively strong during this period; it would seem that the wind is capable of mixing, but due to the lack of rainfall, there are no strong negative surface salinity anomalies available that can serve to freshen the mixed layer. An analysis for float 12360 (not shown) yields similar results. Other factors such as horizontal advection by mean currents and Ekman effects, not accounted for in this simple interpretation, also surely play an essential role in setting the properties of the mixed layer, as Yu (2014) clearly shows.
Storm Influences on SSS Near the ITCZ
The SPURS-2 site was chosen in order to be able to sample the ocean in a regime with strong seasonal precipitation. As is evident in Figure 4, the highest rainfall during the SPURS-2 study period (as measured by float 8435) was observed in October and November of 2016. The monthly averaged rainfall at that float during October 2016 was over 60 mm d–1. This amounts to an annual accumulation of over 20 m if this rainfall rate continued over an entire year, an immense value. Of course, the value of 60 mm d–1 was the single maximum value for the entire year, not the average value. From Figure 4, we estimate that the average value of rainfall over the year was closer to about 12 mm d–1, still amounting to an annual accumulation of about 4 m of rain. The Figure 4 rainfall estimates indicate that the rain is highly variable over the annual cycle, and even variable month to month. As noted earlier, the ITCZ is a region of strong atmospheric convection that results in storms with high rain content. In order to attempt to view the nature of such storms, we examine the region around float 8435 in late October 2016, when the PAL-sensed rainfall was near a maximum for the year (this corresponds to the gray-shaded and dashed time period shown in Figure 4). Examination of the hourly values of rainfall during this period shows especially large spikes around October 21 and 22. In Figure 5 we show mapped values of rainfall deduced from GPM satellite-based data for the region in the vicinity of float 8435 during a portion of those days. A large storm several hundred kilometers in extent can be seen in the figure that passes very close to the position of the float; the float did not surface until October 24 (three days after the storm passed), but the SSS measured upon surfacing was still very low (~33 psu), with a mixed layer salinity near this value as deep as 50 m. As can be seen in Figure 5, the storm was located near 10°N, 122°W on the evening (1830 GMT) of October 21, with rainfall rates of 10–15 mm hr–1. By early the following morning (0330 GMT), the storm had strengthened and was centered near 9°N, 125.5°W, with maximum rainfall rates as high as 40 mm hr–1, equivalent to about 1 m of rainfall per day. The storm thus appeared to translate westward during this time at a speed of 10 m s–1. A few hours later (0530 GMT), the storm had weakened slightly, with precipitation rates closer to 30 mm hr–1. Clearly, high instantaneous rain rates such as these are not sustainable and probably occur only during strong storms. This example serves to show that the rainfall climatology for this region is likely dominated by an ensemble of strong rain events over the year rather than being the result of continuous precipitation over the annual cycle.
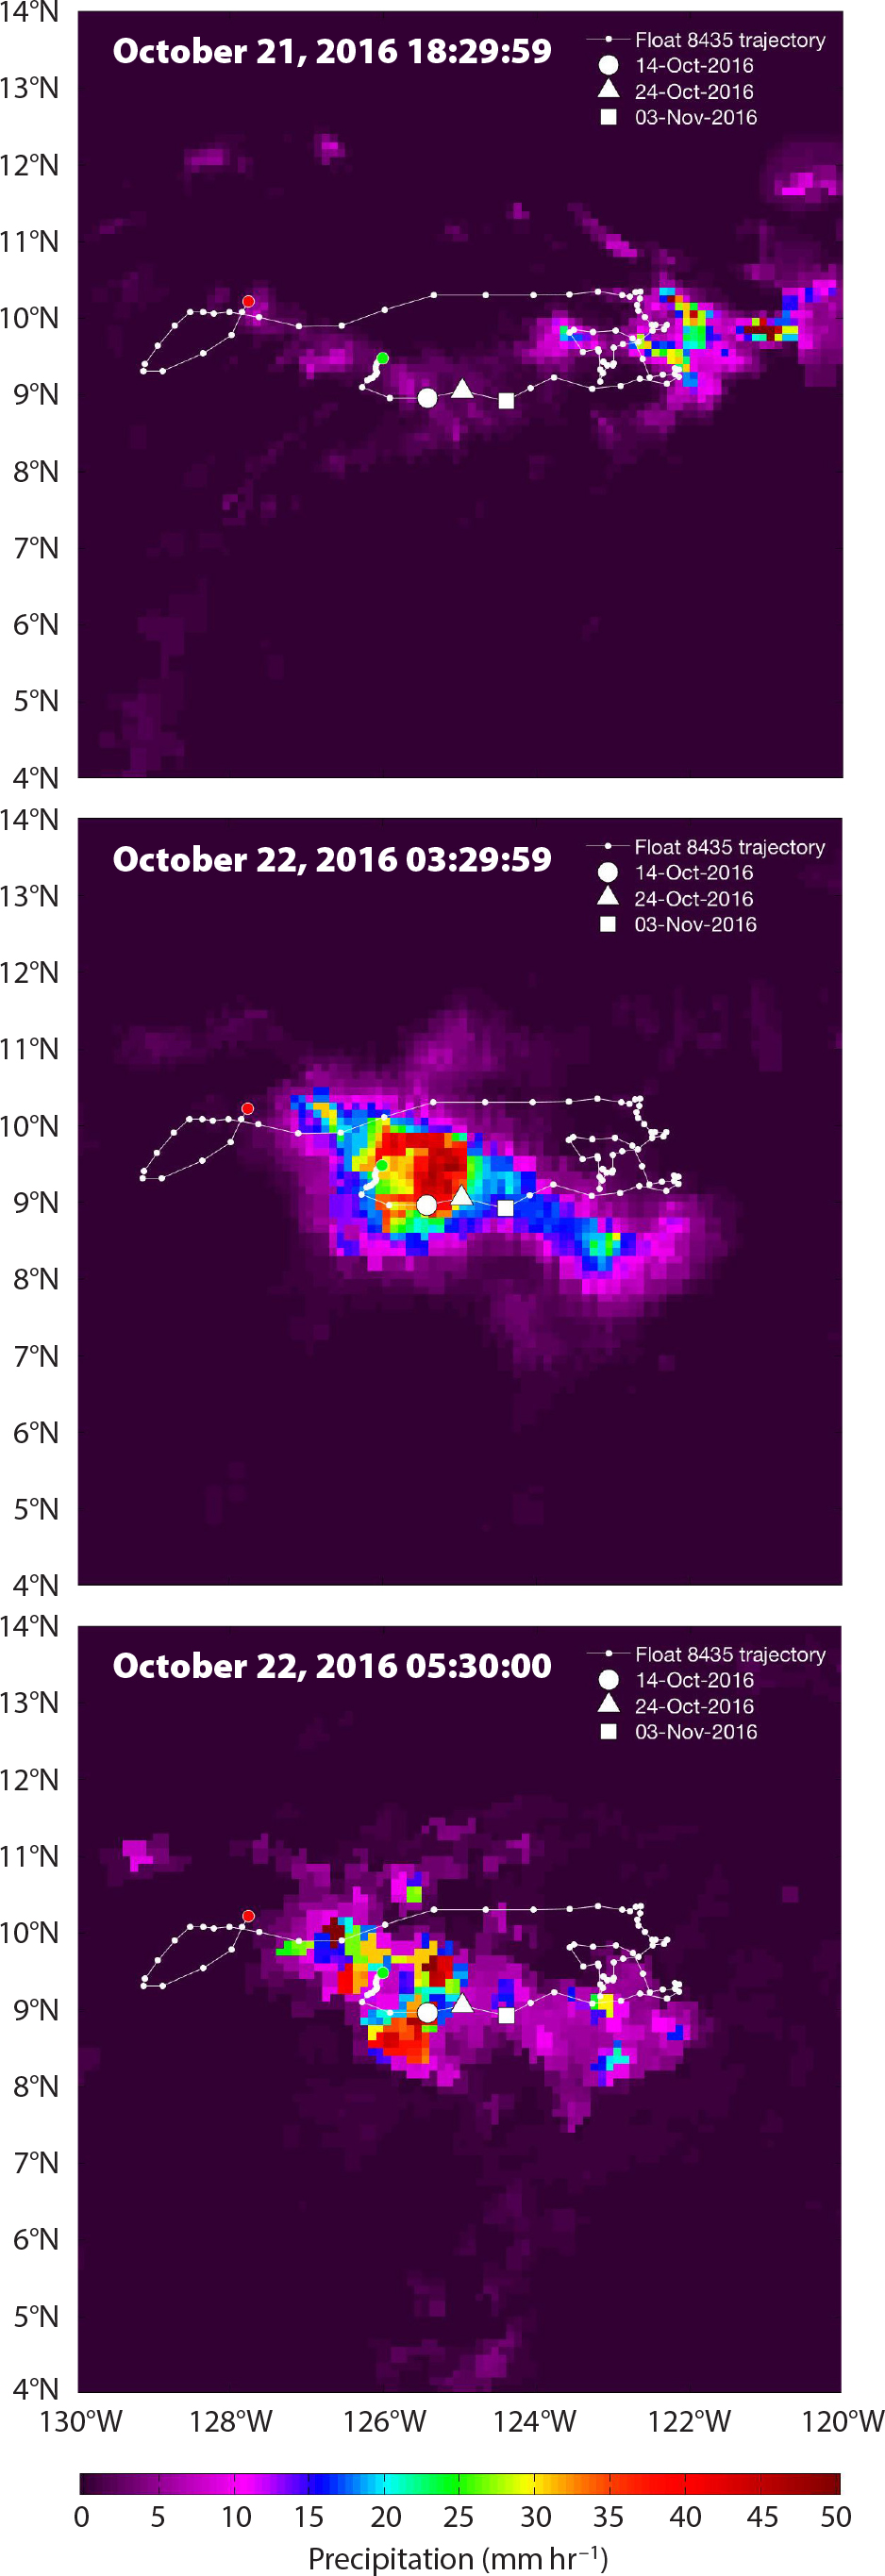
FIGURE 5. Maps of GPM-derived precipitation for the SPURS-2 region on October 21 and 22, 2016. The white line traces the trajectory of float 8435, with dots at 10-day intervals. Symbols show the float positions on October 14, October 24, and November 3, 2016. > High res figure
|
Annual Accumulation of Freshwater from Rain
An important goal of SPURS-2 was to understand the role of rainfall in determining the near-surface salinity in the ocean by examining the details of precipitation and upper-ocean mixing processes. On longer timescales, it is useful to observe and understand the annual cycle and accumulation of rainfall in the region. As the float-based PALs deployed in SPURS-2 operated in excess of one year, we can estimate the accumulated rainfall over the duration of the experiment, as shown in Figure 6.
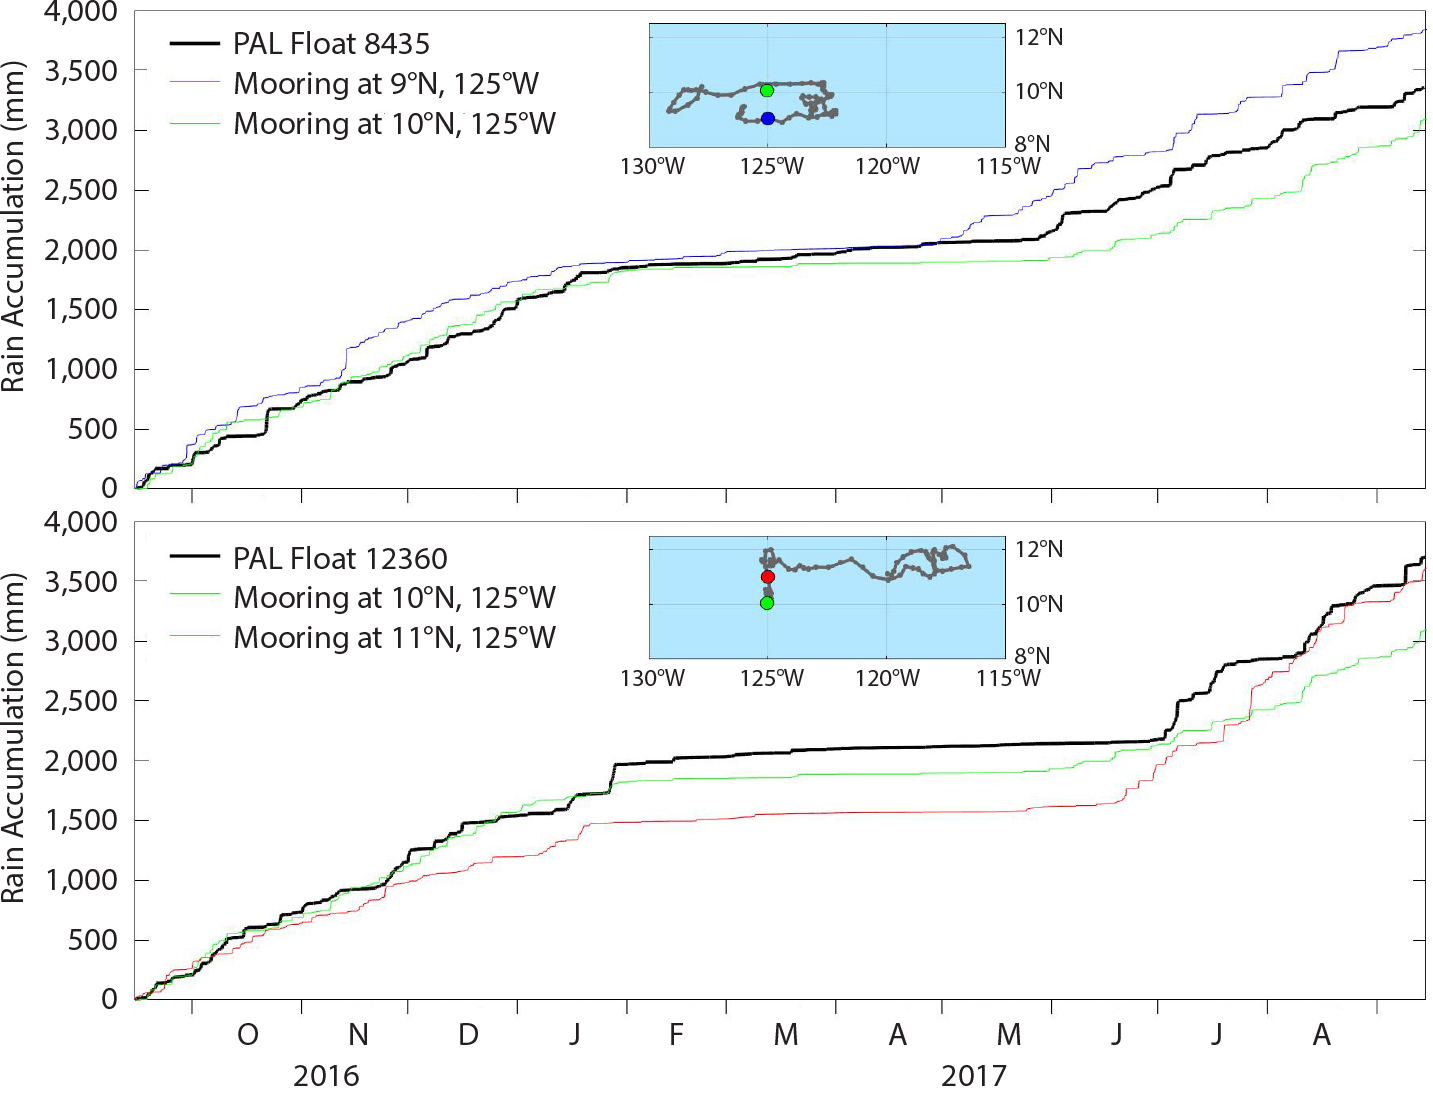
FIGURE 6. Integrated PAL-derived rainfall for floats 8435 and 12360 from September 2016 through September 2018 along with analogous values derived from rain gauges on SPURS-2 moorings. The insets show the float trajectories and the locations of the moorings relative to the floats. > High res figure
|
For comparison purposes, Figure 6 shows both the net accumulation of freshwater due to rainfall along the tracks of floats 8543 and 12360 over the first year of the SPURS-2 experiment and also the cumulative rainfall measured at two SPURS-2 moorings near the floats (the colored dots on the float trajectories shown in the figure). The precipitation data from these surface moorings were collected using traditional-style gauges that measure rainfall directly. As can be seen in Figure 6, the PAL-based rain accumulation estimates agree very well with the observations at the moorings, reiterating the power of simple, acoustically based measurements of rain from floats and other platforms.
The PAL/float and moored estimates of net rain accumulation generally agree to within 10%–15% over the year. All of the net accumulation estimates show that rainfall increases from early autumn to mid-winter, then plateaus in spring and early summer when it nearly ceases, and then increases again in summer and into autumn. The modest differences between the three estimates on each panel are likely due to variability in annual rainfall over spatial scales of a few degrees of latitude or longitude along or across the frontal boundary of the ITCZ, as well as the fact that the floats are moving and only briefly are collocated with the moorings. For float 8543, the net rain accumulation over the year falls equally between the estimates from the moorings at 9°N and 10°N along 125°W; the differences as measured on the two moorings imply gradients in net precipitation of this spatial scale across the frontal boundary, and the PAL-based integral from float 8543 is not inconsistent with this inference. For float 12360, the net accumulation of rainfall along its path over the experimental period is also consistent with the moored estimates of rainfall that show differences between the two moorings (located 1° of latitude apart) of 15% in total annual rain although the float moved nearly 10° of longitude to the west along 10°N during the year.
Summary and Conclusions
The eastern tropical Pacific is a region of strong zonal motion in both the ocean and the atmosphere, although it is the meridional component of the wind that results in the ITCZ in the eastern Pacific. The seasonality of this convergence leads to variability in atmospheric convection and storms, which in turn drive concurrent variations in surface wind speed and sea surface salinity. The simple insight gained into the links between these parts of the climate system derive from modern observational tools such as satellites capable of sensing wind and rain, profiling floats that can observe T and S as well as rainfall and wind over extended periods, and moorings capable of making sophisticated meteorological measurements. Quantification of the hydrological cycle over the ocean is quite difficult, but these modern observational tools have allowed unprecedented advances to be made on this research problem. The results from this and other SPURS-2 studies should lead to better ocean models and, eventually, improved
coupled climate models.
The observations discussed herein and other work carried out as part of SPURS-2 generally took place over a period of no more than two years, and thus it is difficult to know how representative these local results are of longer-term variability in the eastern tropical Pacific, although they are not inconsistent with the analyses given by Guimbard et al. (2017). This is a region of strong interannual variations due to El Niño-Southern Oscillation effects (McPhaden, 2015), and we cannot be confident that we know how the results described here might change in the presence of a strong El Niño or La Niña event (Cai et al., 2015). Indeed, both warm (El Niño) and cold (La Niña) events were present in the SPURS-2 region in 2016 (Blunden and Arndt, 2017). Given the outsized importance of this region to larger-scale climate variability in the Pacific region and beyond, it seems important to be able to continue to collect the kinds of measurements discussed here over a much longer period of time, which should result in better insight into the freshwater cycle along the equator and its implications to climate variability.

